
Author: Olegh Bondarenko
Timely identification of places of illegal logging is a task that is urgent almost all over the world. It is clear that although only remote methods can be considered for this, not all of them ensure timely detection. Of course, satellite images can almost perfectly detect the localization of areas of destroyed forest, but in reality they have certain limitations due to their relatively long update cycle (especially in cloudy areas). Therefore, when it comes to prompt detection and notification of logging in near real time, other technologies are needed. Among them, we can mention acoustic sensors that can pick up the specific sounds of chainsaws and logging equipment. Such systems operate in near real-time and can automatically report activity that may indicate illegal logging.
The work and materials were carried out and prepared within the framework of the More4Nature project, implemented by the National Ecological Center of Ukraine.
More4Nature aims to bring about transformative change in environmental protection by including citizens and communities as key actors in collaborative environmental compliance assurance.
Content
Goal
General plan of works
Instrumental tools
Field research
∘ Routes
∘ Placement of measuring equipment
Route profiles
Analysis of measurement results
∘ Analysis of the sounds of logging and firewood harvesting
∘ A typical chainsaw spectrum on various recording devices
∘ Characteristics of the chainsaw spectrum
∘ Dependence of spectrum intensity on distance
∘ Artifacts and comparison with chainsaw spectrum
Results
Conclusions
∘ Construction of a stationary monitoring network
∘ Vision of the development of monitoring tools
∘ The issue of automated identification
Appendix 1. Technical characteristics of acoustic measuring equipment
References
Acknowledgments
Ukrainian text
Goal
The main goal of this work was to study the technical capabilities of monitoring, detecting and identifying illegal logging sites using acoustic methods.
General plan of works
The works include the following stages:
- Preparation of instrumental and computational tools and methods for conducting field research.
- Organization and conduct of field research.
- Processing of collected field research data.
- Presentation of results, conclusions, reporting.
Instrumental tools
The following tools were used for the work:
- Acoustic recording devices (see Appendix 1):
- Song Meter Micro Wildlife Recorder | Wildlife Acoustics
- Song Meter Mini 2 Li-ion | Wildlife Acoustics
- Song Meter Mini Bat 2 Li-ion | Wildlife Acoustics
- SV200A Noise monitoring station
- Noise source: Hand chainsaw Husqvarna 340 XP, noise level 101 dB, gasoline engine, number of revolutions 9000 rpm (150 Hz), engine volume 40.8 cubic meters. cm, engine power 2.7 hp, number of cylinders 1, weight 4.7 kg
- A software tool for building and analyzing spectra and spectrograms of audio files: Audicity is a free multi-platform software for editing and analyzing audio data, focused on working with multitrack files. It allows to perform such functions as building a spectrum of a given fragment as well as spectrogram.
Field research
Routes
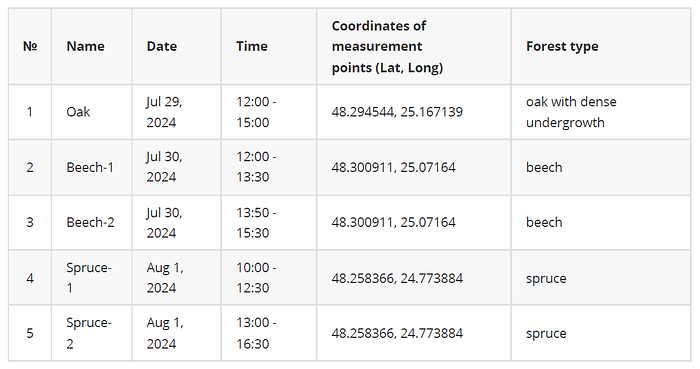
The measurements were carried out along five routes in the Kosiv district of the Ivano-Frankivsk region of Ukraine, in the vicinity of the village Kosmach (Table 1).
Table 1. Basic data of the five completed research routes.
Placement of measuring equipment
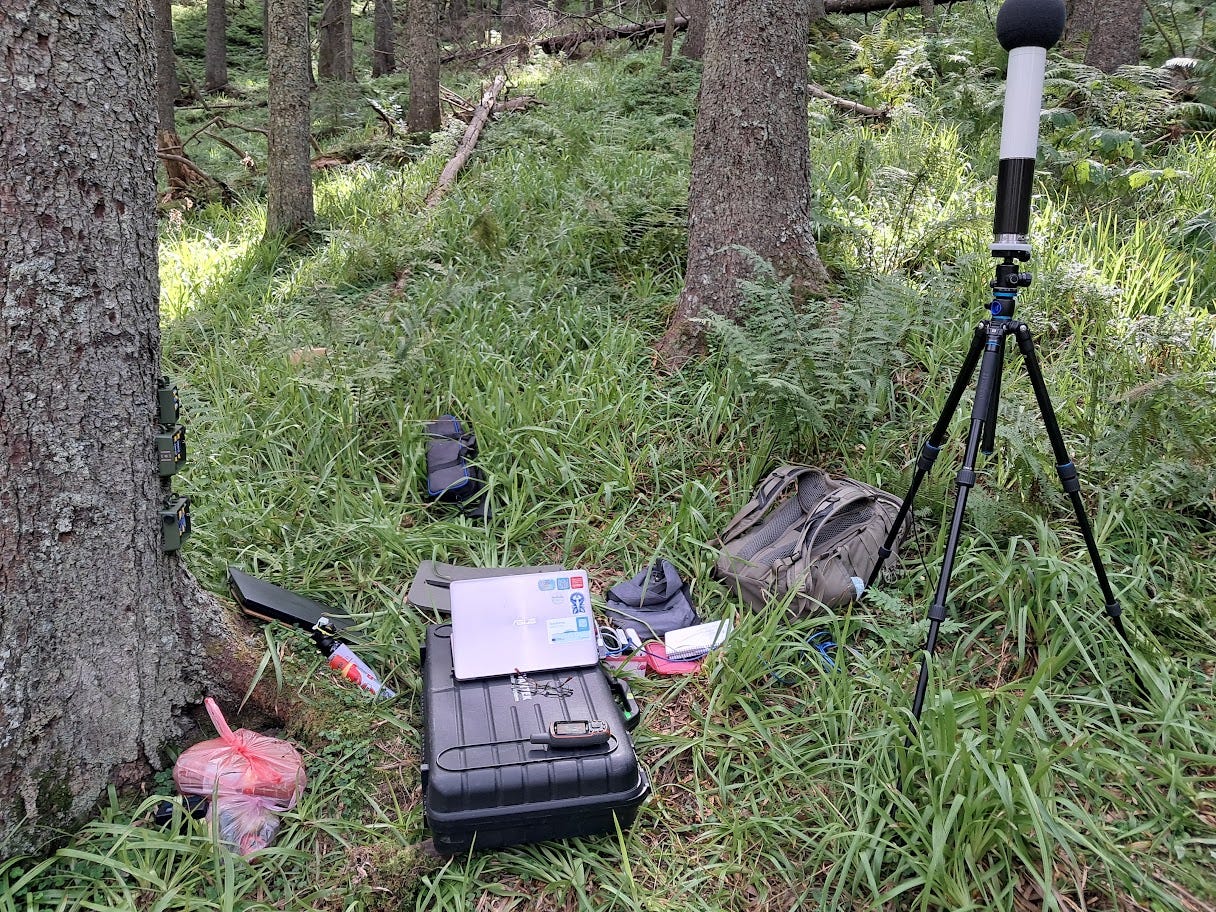
At each measurement point, three Song Meter-type devices were attached to a tree trunk at a height of about 1 m from the ground surface. The SV200A acoustic station was mounted on a tripod next to the first three. A typical placement of acoustic equipment is shown in the photos below.


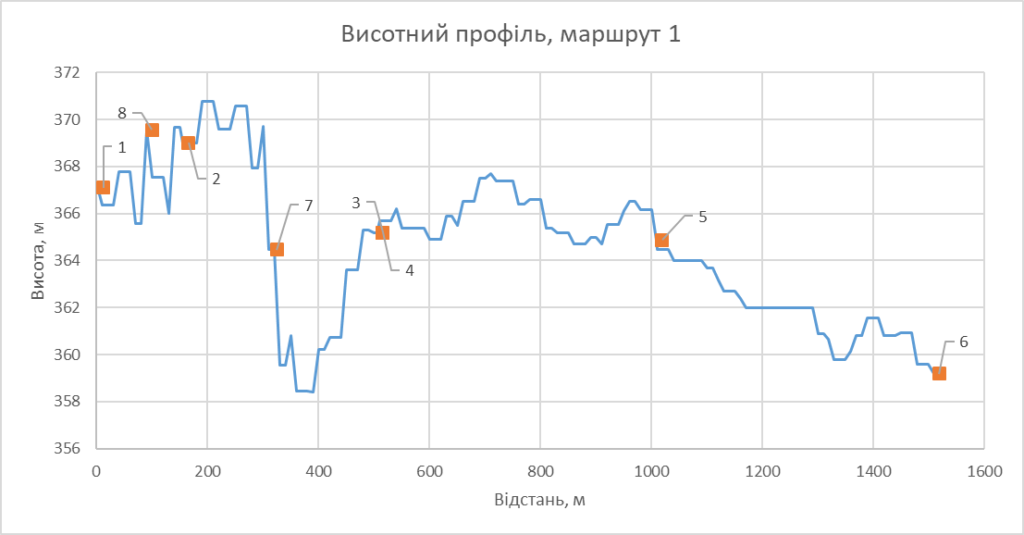
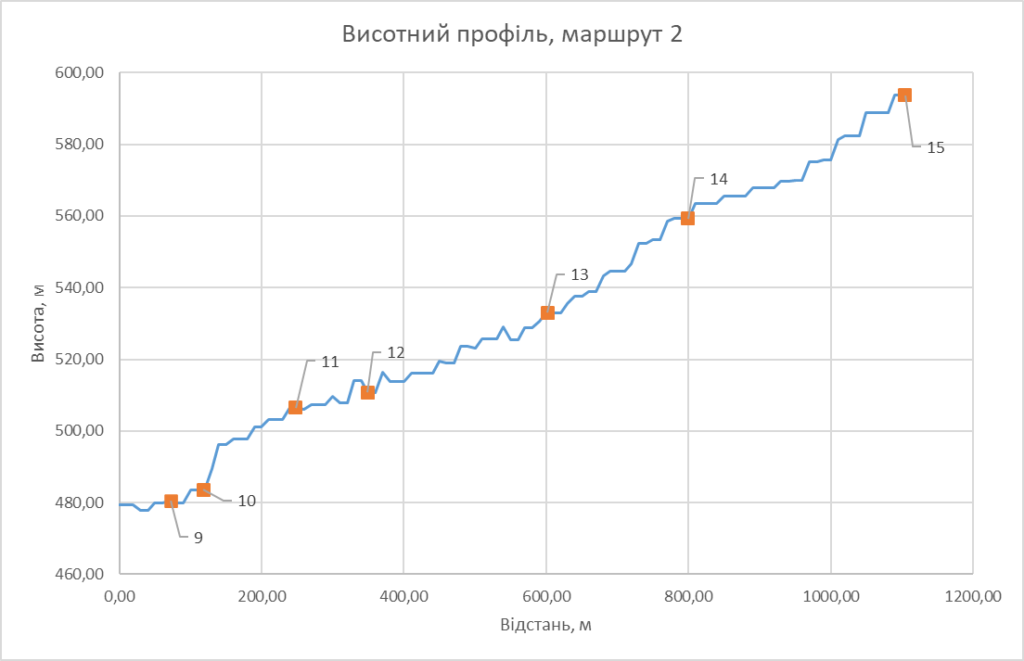
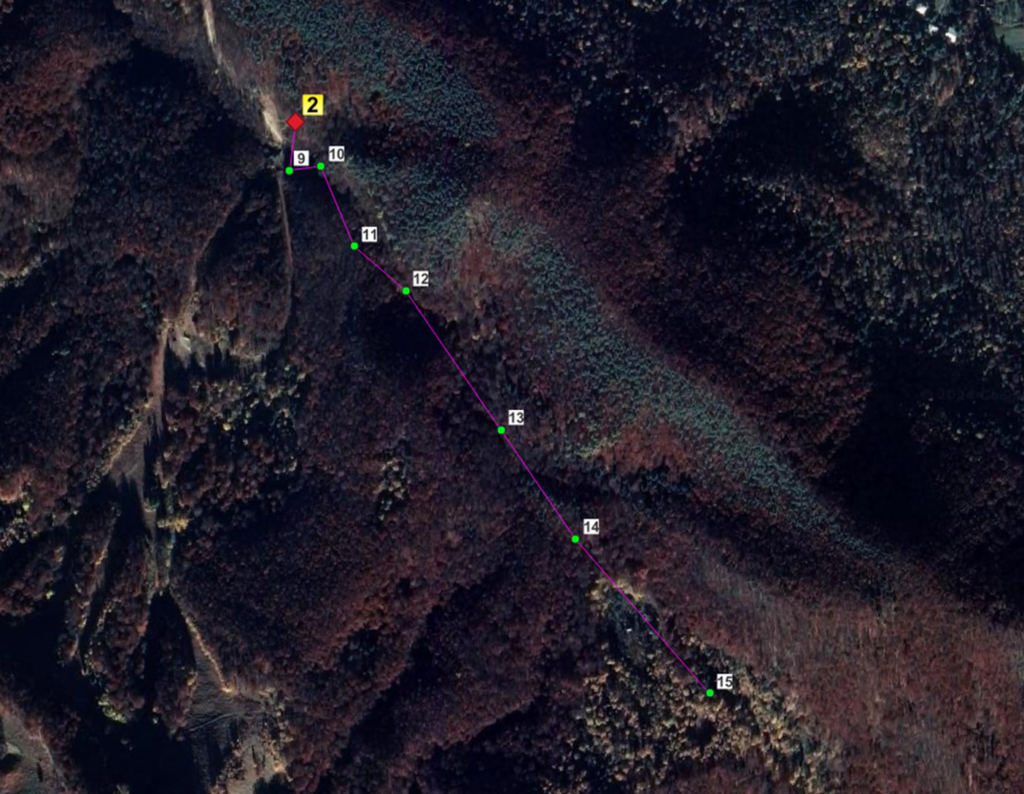
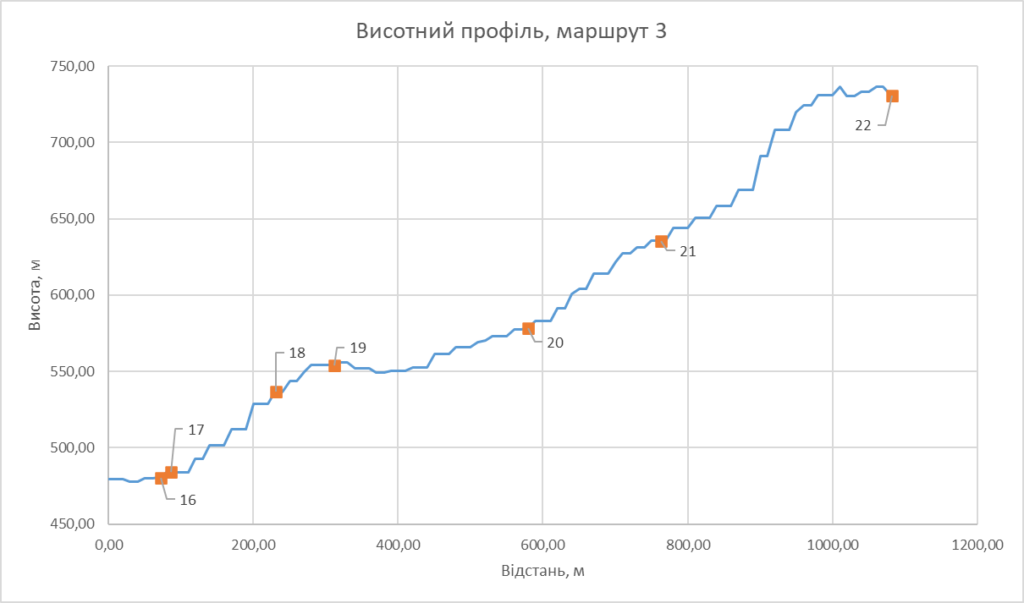
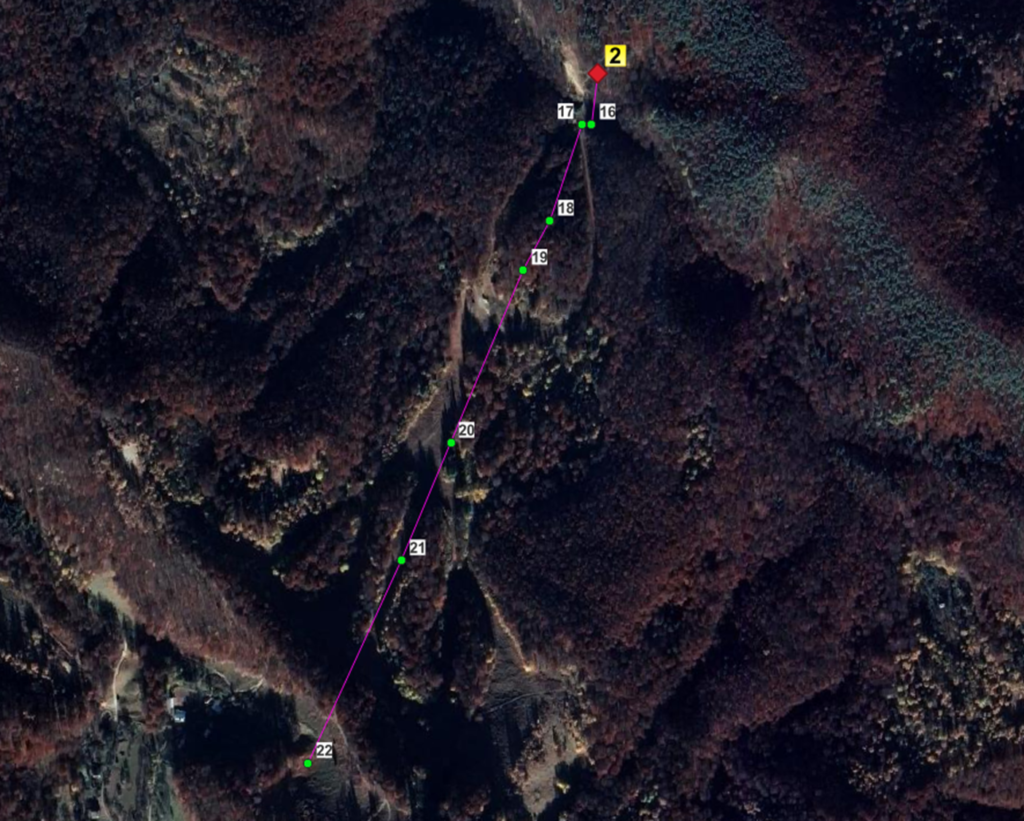
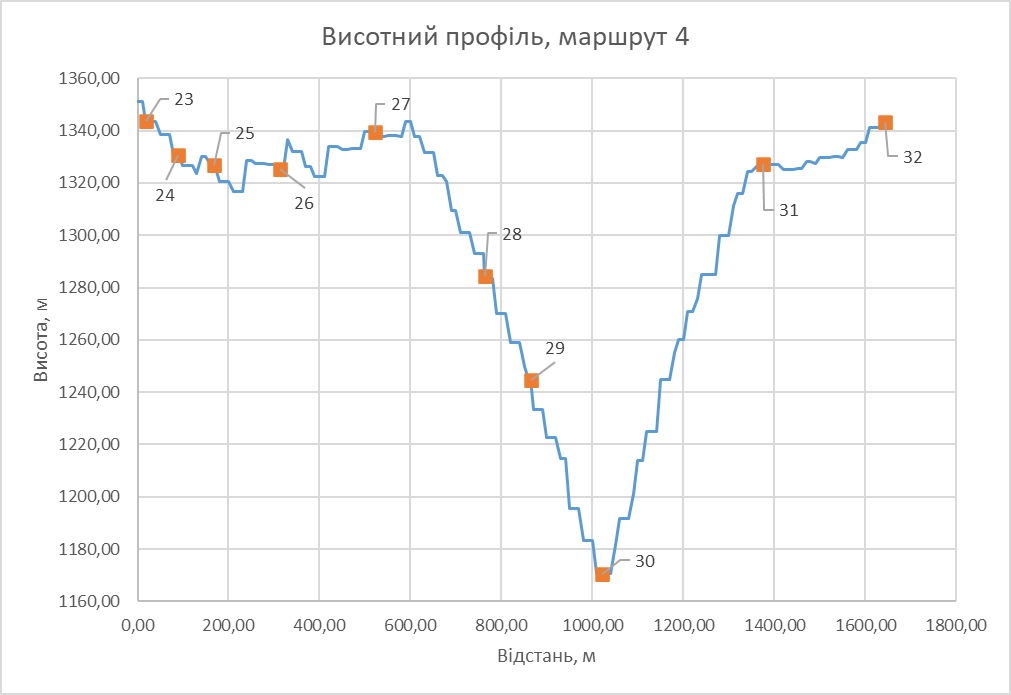
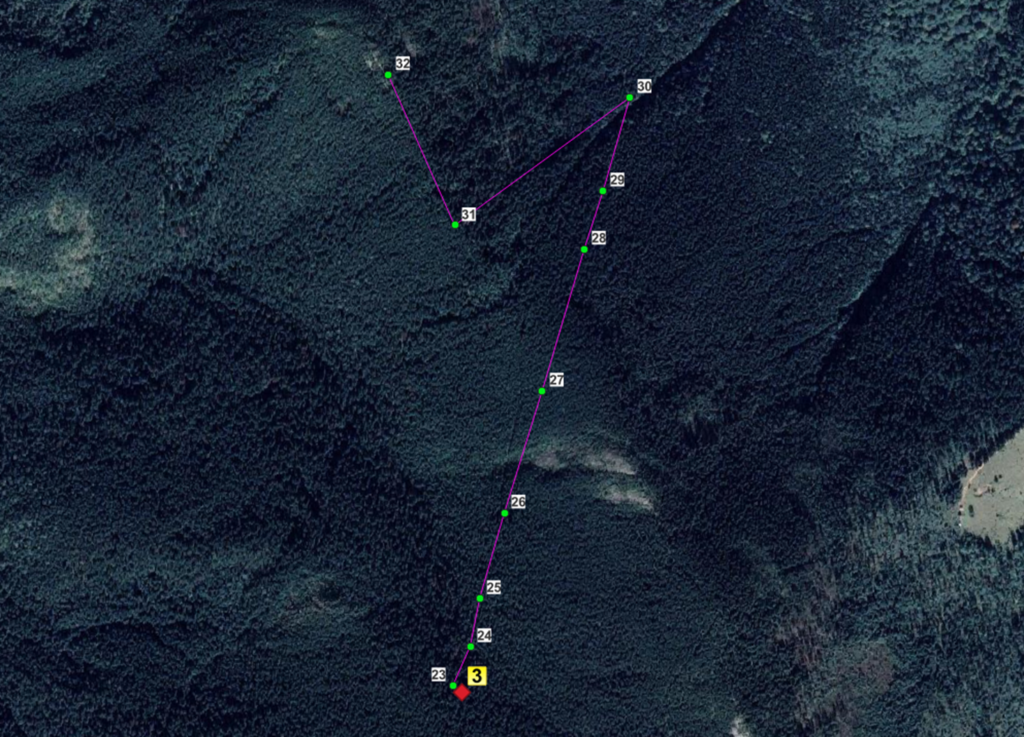
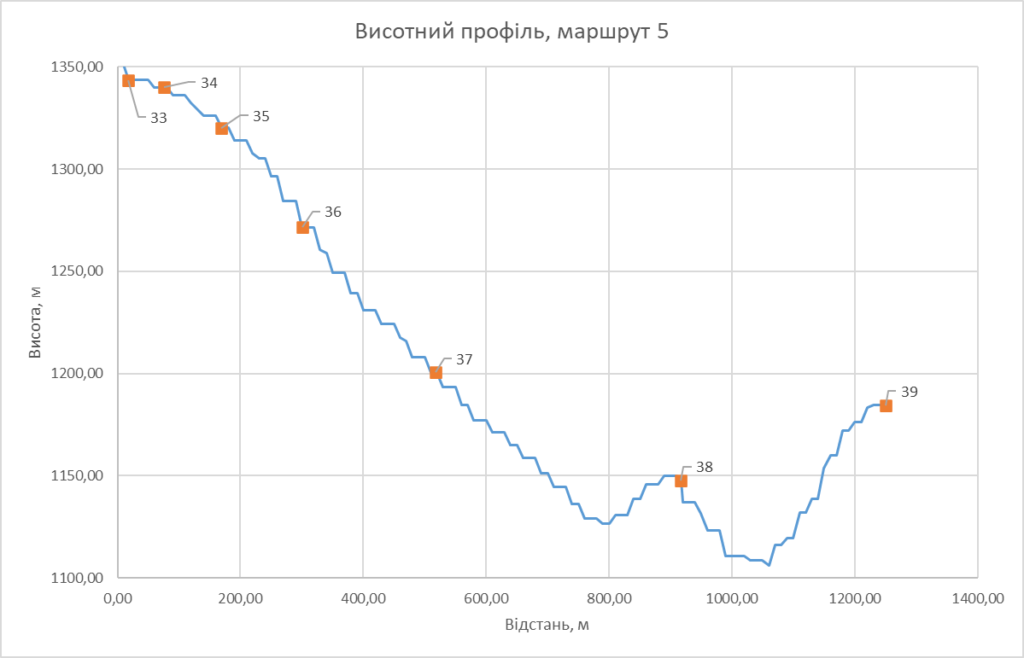
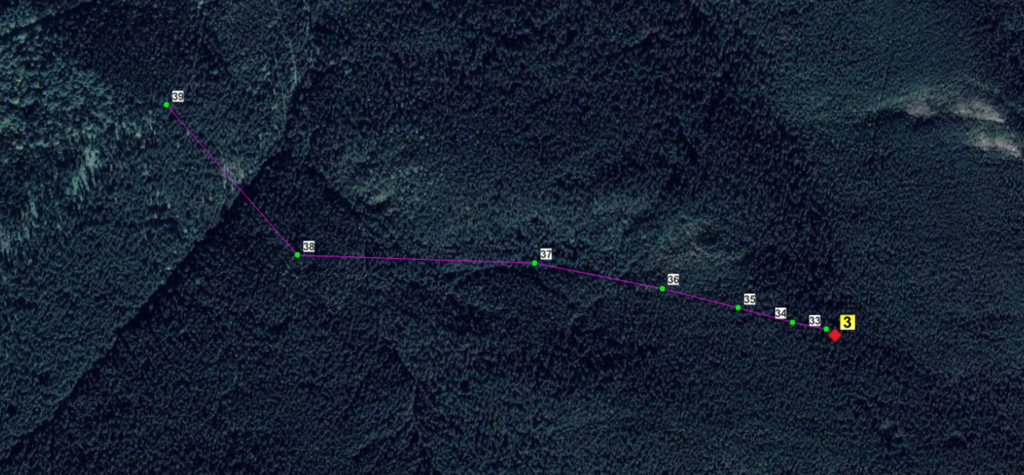
Route profiles
The measurements were carried out as follows. The acoustic measuring equipment was placed at a pre-planned point. The group of researchers was divided into two parts — the first remained near the acoustic equipment, the second moved along a predetermined route from the measurement point and turned on the noise source — a chain saw in the planned points. Radio communication was used to turn on and off the recording of the acoustic measuring equipment synchronously with the operation of the chainsaw.
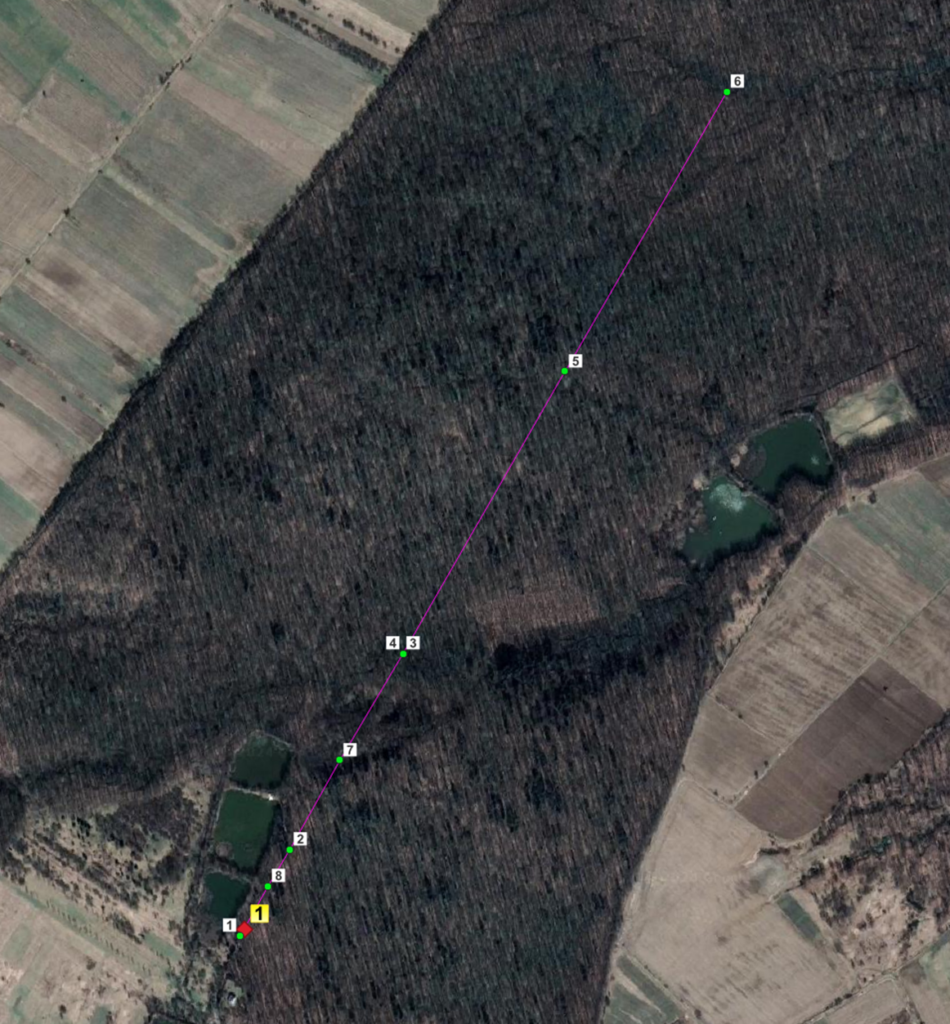
The following routes are mapped along with their elevation profiles according to Table. 1:
Analysis of measurement results
Analysis of the sounds of logging and firewood harvesting
One of the most typical sounds that accompany felling and gathering firewood is the sound of a manual chainsaw.
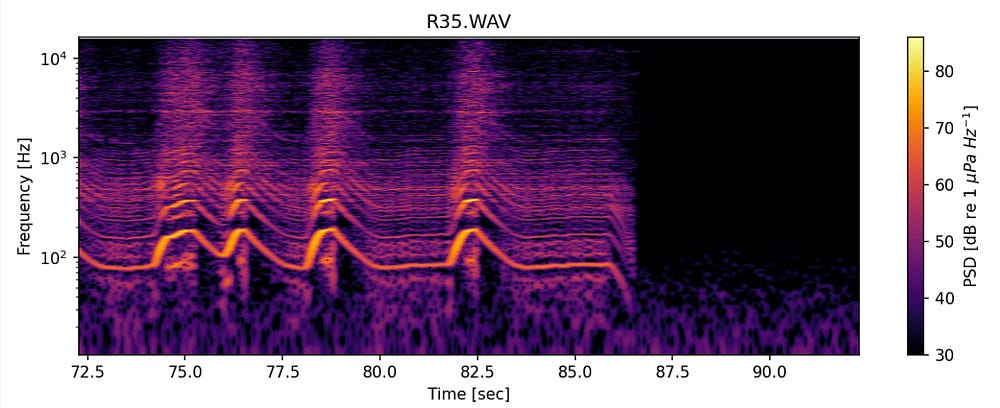
The chainsaw emits a typical multi-band spectrum of sound during operation. Spectrograms are used to visually represent this spectrum. A spectrogram is a visual representation of the frequency spectrum of a signal over time. The most common representation of a spectrogram is a two-dimensional diagram: time is represented on the horizontal axis, frequency is represented on the vertical axis; the third dimension indicating the amplitude at a specific frequency at a specific moment in time is represented by the intensity or color of each point of the image [1] .
The spectrogram of the chainsaw sound during idling operation is presented in Fig. 1 below. As can be seen from the spectrogram, the main frequency is about 80 Hz. Several bursts of this band in the region of higher frequencies are caused by short-term “overgassing”.
A typical chainsaw spectrum on various recording devices
Due to the fact that several types of devices (acoustic stations) were used in the experiment, it is important to compare their response in the same conditions of the acoustic environment. A specific example shows a comparison of three devices:
- Song Meter Micro
- Song Meter Mini 2
- SV200A
The frequency response of the devices was compared under the conditions of their simultaneous stay at one point, when they:
- measured the sound of a chainsaw located at a distance of 75 m and
- in conditions of “silence” (that is, natural sounds of the forest and wind).

As can be seen from Fig. 2 In terms of background spectrum, SV200A was closest to classic red noise [2] in a wide frequency range from 20 Hz to 20 kHz. In contrast, the Song Meter Micro showed two broad peaks in the background spectrum at 1 and 6 kHz, an upper frequency limit of about 10 kHz, and a low-frequency collapse below about 150 Hz. Similar to the Song Meter Micro, although slightly better (without two clearly defined peaks), the spectrum of the Song Meter Mini looks like.
Characteristics of the chainsaw spectrum
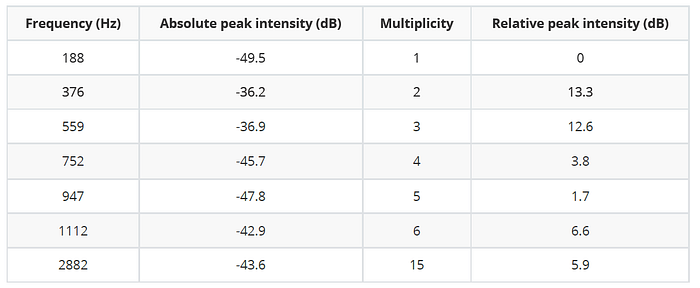
Based on the quality indicators of the acoustic stations, the SV200A was taken for the analysis of typical spectra. Visually, at least 7 distinct peaks are observed on the spectra from different distances. Table 2 presents the main modes of the spectrum of the chainsaw, in moderate load mode, at a distance of 150 m, on the “Smereka” route. In addition to the frequency and absolute intensity of these peaks, the table provides: (1) the multiplicity of the peak frequency relatively to the frequency of 188 Hz, as well as (2) the relative intensity of the peak, that is, its height relative to its foot.
Table 2. The main modes of the chainsaw spectrum, in moderate load mode, at a distance of 150 m.
Dependence of spectrum intensity on distance
For three days, five series of measurements were carried out along different routes at three locations: “Oak”, “Beech”, “Spruce” (see section “Field research”).
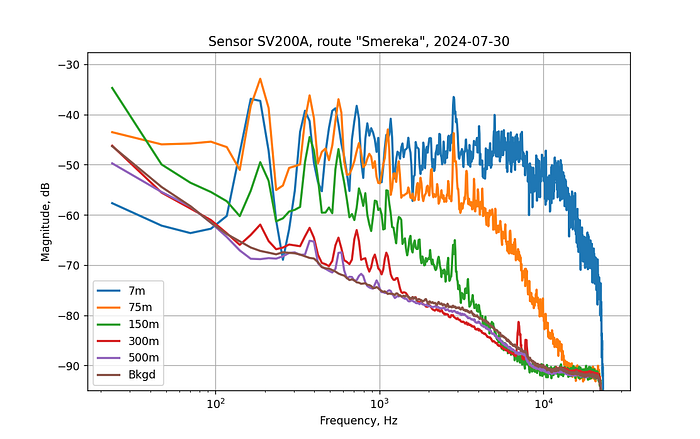
As a typical result in Fig. 3 shows the spectra of chainsaw sound at different distances along the “Smereka” route.
As can be seen from Fig. 3 high frequencies fade out quite quickly with distance and already at a distance of 300 m the spectrum above 1100 Hz is almost equal to the background (Bkgd). The relative intensity of peaks with a frequency below 1100 Hz naturally decreases with distance, while maintaining the intensity ratio between them. The last distance is 500 m, at which the two largest peaks can be reliably distinguished on the spectrum – 376 and 559 Hz and less reliably 752 and 947 Hz. Already at a distance of 750 m, neither the spectrum nor the spectrogram reveal signs of individual peaks.
It is noteworthy that at a distance of 500 m, the sound of a chainsaw could not be heard by human hearing.
Artifacts and comparison with chainsaw spectrum
Multi-band character of the spectrum is a good indication of extraneous noise in the forest, but this criterion should be used with caution.
As an example, it is worth considering a fragment of the spectrogram of the Song Meter Mini 2 device, obtained on the “Smereka” route (Fig. 4), where a striped spectrum is clearly visible.
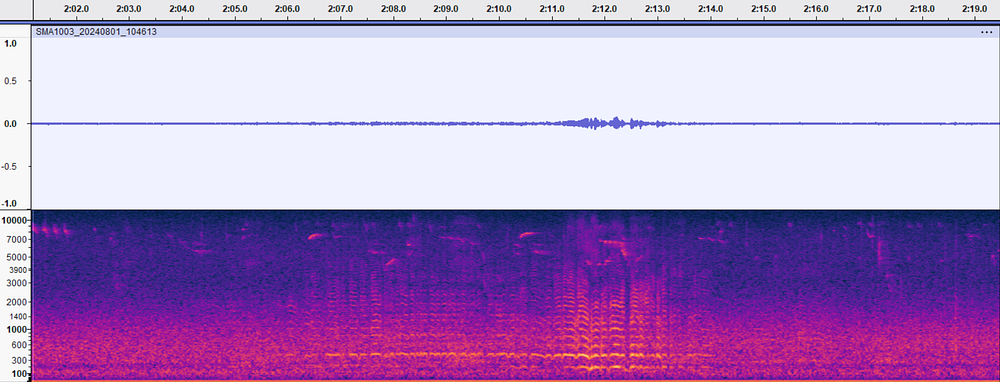
The analysis of the spectrum of this fragment is given in Fig. 5.
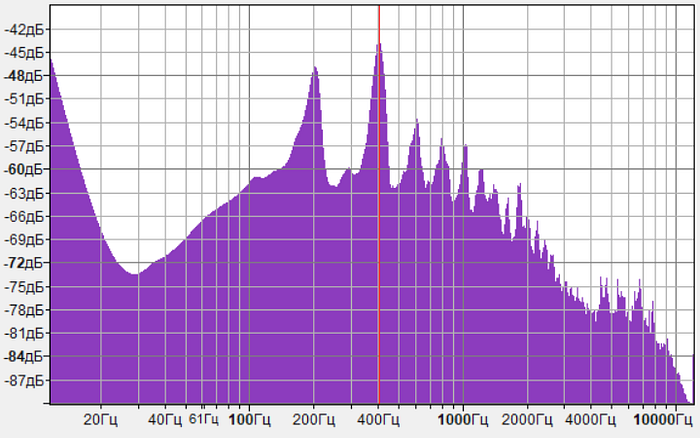
A number of 200 Hz frequency harmonics are clearly identified on the spectrum: from 200 to 1800 Hz.
Human listening turned out to be the determining factor in identifying the source of the origin of this sound:
It turned out that it was a fly sitting on the protective paralon cover of the microphone! 😄
Results
- Types of forests. Research was conducted in three types of forests: (1) oak with dense undergrowth, (2) beech, (3) spruce. The last two types of forest were without undergrowth.
- Human hearing sensitivity. With human hearing, a person can no longer hear the sound of a chainsaw in an oak forest (1) at a distance of 300 m. While for beech and spruce types of forests, human hearing loses the sound of a chainsaw somewhere between 300 and 500 m.
- Instrumental sensitivity. It turned out that hardware means can detect the sound of a chainsaw at distances greater than a person — 500 m or more thanks to the analysis of the spectrogram and the spectrum recorded by acoustic stations. But already at a distance of 750 m, it was not possible to detect the sound of the chainsaw against the background.
- Toolkit. Four acoustic stations were used in the research: Song Meter Micro, Song Meter Mini 2, Song Meter Mini Bat 2, SV200A. The SV200A acoustic station turned out to be the best in terms of frequency range — from 20 Hz to 20 kHz. In the rest of the acoustic stations, the frequency range was from 150 Hz to 10 kHz. In addition, the Song Meter Micro showed two broad peaks in the background spectrum at 1 and 6 kHz, which are not typical of natural noise.
- Spectrum structure. The spectrum of the chainsaw demonstrated a multi-band frequency structure with a base frequency of 188 Hz (in the moderate load mode of the chainsaw) and with harmonics having multiples of 2, 3, 4, 5, 6, 15. As the distance of the sound source from the acoustic station increased, high frequencies faded faster — at a distance of 500 m, peaks in the range of 300–1000 Hz remained distinguishable.
- Sound identification. Automated identification of sounds of man-made origin, inherent in forest felling, based only on the sign of multi-banding can be misleading. Thus, in one of the observations, a short-term striped spectrum with a base frequency of 200 Hz and multiple harmonics up to 1800 Hz was recorded. After more detailed analysis and listening, this sound was identified as the flight of a fly, most likely at a distance of a few centimeters.
Conclusions
Construction of a stationary monitoring network
The construction of a stationary acoustic monitoring network will face significant limitations. When the sensors of such a network are located on trees (that is, in the thick of the forest), the event detection distance is limited to a distance of about 500 m. This means that to build a dense monitoring network, the distance between neighboring sensors should not exceed 2*500 = 1000 m. For reliability, we take 750 m. The structural element of the network will be an equilateral triangle with a side of 750 m, in the corners of which acoustic monitors are placed. The area of such a triangle will be ~ 0.49 km. That is, in order to cover an area of 100 sq. km will require more than 200 acoustic stations.
Next, it is necessary to take into account that each acoustic station must be made in an all-weather version, must have autonomous power and means of communication for data transmission. Such requirements will significantly increase the cost of each station. Also, maintenance of the network will add significant operational costs.
Vision of the development of monitoring tools
One of the promising alternative options for the development of means of acoustic monitoring of large area objects for unauthorized man-made activity may be the use of acoustic locators on board UAVs (electrically driven). Such locators, as a rule, use an array of MEMS-type microphones and can use signal processing algorithms to determine 3D DOA, that is, the direction of the sound source in space. Despite the fact that the UAV is an independent source of acoustic noise, there is a lot of development in the world using this approach from aboard the UAV. For example, one of the early works in this direction is here [3]. In fact, today this direction is actively developing, hundreds of works have appeared, all of this requires a separate study.
If with this method it is possible to cover a strip with a width of, say, 300 m from a height of 100 m (150 m in each direction from the UAV), then at a moderate speed of the UAV of 60 km/h, this means can conduct one overflight of the territory of 100 sq km for ~ 5.6 hour. The functioning of such a monitoring system will require at least two UAV boards and a team of 2–3 specialists.
It is clear that this preliminary assessment and comparison of technical and economic aspects of stationary and mobile monitoring means will require additional efforts.
The issue of automated identification
In both cases — stationary and mobile monitoring devices — the issue of automated identification of detected sound sources will remain. Modern means of sound recognition with the help of trained neural networks are certainly indispensable here.
Appendix 1. Technical characteristics of acoustic measuring equipment
This report contains a brief description and analysis results of the noise measuring devices that are available to our team and, therefore, can be used as part of the work on the m4n project. The report is prepared on the basis of technical descriptions and instructions for the use of devices. The assessment was carried out according to key indicators for these types of devices, including duration of operation, type of power supply, measurement frequency and others.
2.1 Song Meter Micro Wildlife Recorder
The Song Meter Micro recorder is designed for long-term outdoor use. Made of durable polycarbonate plastic, it is UV and weather resistant. The Song Meter Micro is designed for all weather conditions and is waterproof under normal circumstances.
The Wildlife Acoustics Song Meter Mini 2 is a bioacoustic recorder designed to record birds, amphibians, land mammals and other wildlife that make sounds within the range of normal human hearing. The IP67 waterproof housing and extremely long battery life allow you to leave the recorder unattended in the field for long periods of time to collect audio recordings of nearby wildlife. A flexible scheduling system allows you to configure the operation to record only periods of peak activity or to extend the battery life for a long time. The Song Meter Mini 2 is configured primarily via the Song Meter Configurator mobile app via Bluetooth. This free app is available for iOS and Android devices and provides a simple interface to adjust the audio settings of the voice recorder. The application receives periodic status updates from Song Meter recorders within Bluetooth range (usually 10–20 meters). This allows you to check the status of your recorders even if they are out of direct range. The Song Meter Configurator app also lets you create and manage configuration files that can be used to program any Song Meter Mini 2 with settings you can define before deployment. This makes it easy to maintain consistent settings between multiple recorders or multiple deployments in any given project. The Song Meter Mini 2 records audio in the widely supported .wav format, which means recordings can be viewed and processed in almost any audio program, including Kaleidoscope Pro audio analysis software from Wildlife Acoustics.
2.3 Song Meter Mini Bat 2 Li-ion
The Wildlife Acoustics Song Meter Mini Bat 2 is a bioacoustic recorder designed to record birds, amphibians, land mammals and other wildlife that make sounds within the range of normal human hearing. The IP67 waterproof housing and extremely long battery life allow you to leave the recorder unattended in the field for long periods of time to collect audio recordings of nearby wildlife. A flexible scheduling system allows you to set the operation to record only periods of peak activity or to extend the battery life for a long time. The Song Meter Mini Bat 2 is primarily configured through the Song Meter Configurator mobile app via Bluetooth. This free application is available for iOS and Android devices and provides a simple interface to adjust the audio settings of the voice recorder. The application receives periodic status updates from Song Meter recorders within Bluetooth range (usually 10–20 meters). This allows you to check the status of your recorders, even if they are out of direct range. The Song Meter Configurator app also lets you create and manage configuration files that can be used to program any Song Meter Mini Bat 2 with settings you can define before deployment. This makes it easy to maintain consistent settings across multiple recorders or multiple deployments in any given project. The Song Meter Mini Bat 2 records audio in widely supported .wav and .zc formats, which means recordings can be viewed and processed in almost any audio program, including Kaleidoscope Pro audio analysis software from Wildlife Acoustics.
2.4 SV200A Noise monitoring station
The SV200A noise monitoring station is a top-of-the-line station with built-in microphones to detect noise directionality. This revolutionary solution allows you to identify the dominant sources of noise, providing information about their location in both vertical and horizontal directions. In practice, directivity measurement makes it possible to indicate the dominant source of noise in the measurement area or to exclude unwanted events.
Four additional microphones, located on the sides of the case, use the sound intensity technique to determine the direction of the dominant noise source in both the vertical and horizontal axes. The distribution of Leq in corner sectors is stored as a time history and can be used for data filtering and reporting.
The station can perform real-time frequency analysis in 1/1 and 1/3 octave bands and store it as time history data. Additionally, it can record an audio signal for recognizing noise sources and calculating data.
The Advanced Alarms function allows you to send email and SMS alerts. caused by threshold level conditions combined with time conditions. Station status signals are also available.
4G modem, WLAN and LAN provide fast data transfer via the Internet to a PC with a standard Internet connection. SvanNET provides plug & play Internet connectivity and easy management of measurement projects. Regardless of the type of SIM card, public or private, SvanNET will establish the connection, providing full access to the measurement data via a web browser. Bluetooth® and wireless LAN provide an access point for easy setup with the SvanNET app.
In accordance with the requirements of ISO 1996–2, the SV 200A uses an electrostatic actuator to perform a periodic system check. Checking the complete measurement circuit, including the microphone, is an advantage of using the electrostatic drive method.
A precise GPS module provides location information as well as time synchronization measurements.
References
[1] Spectrogram — Wikipedia
[2] Brownian noise — Wikipedia
[3] A. Finn and S. Franklin, “Acoustic sense & avoid for UAV’s,” 2011 Seventh International Conference on Intelligent Sensors, Sensor Networks and Information Processing, Adelaide, SA, Australia, 2011, pp. 586–589, doi: 10.1109/ISSNIP.2011.6146555.
Acknowledgments
We express our gratitude to the project participants and researchers: Oleh Bondarenko, Oleh Pohribnyi, Yevhen Bovsunovskyi, Vitalii Hulevets, and Serhii Savchenko for their significant contributions to the collection, processing, and analysis of acoustic data.
We also extend our sincere thanks to the Hutsulshchyna National Nature Park for their organizational support and invaluable assistance in carrying out this study.

How the acoustic experiment went 🙂

© European Union, 2023
This project has received funding from the European Union’s Horizon Europe research and innovation programme under grant agreement No. 101133983. Views and opinions expressed are however those of the author(s) only and do not necessarily reflect those of the European Union. Neither the European Union nor the granting authority can be held responsible for them.